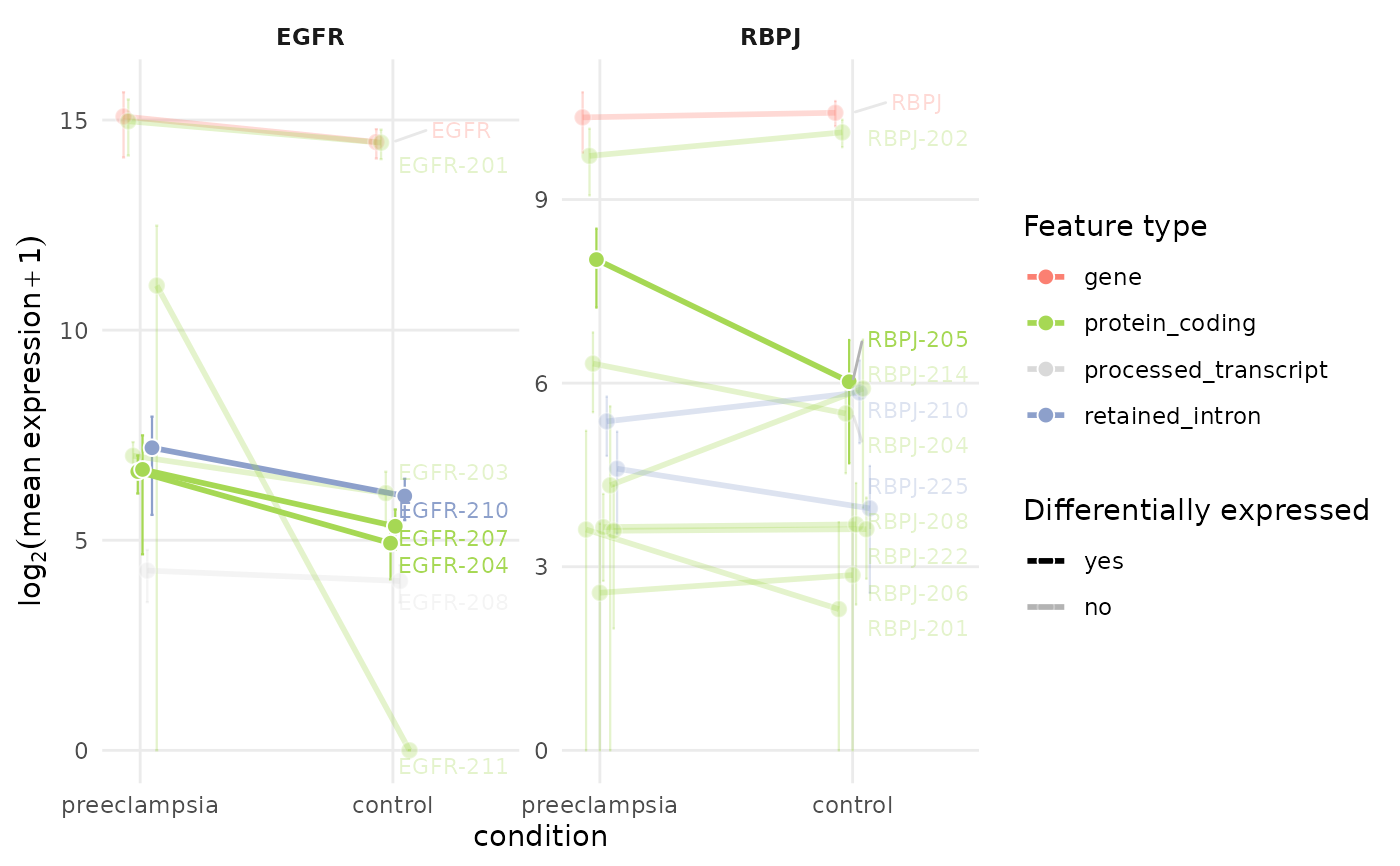
profile_data() summarises the expression of selected genes and of each
of their isoforms per sample group (mean and standard deviation), and
attaches the differential expression calls. plot_tx_expr() draws the
result: one panel per gene, one line per feature (the gene plus its
isoforms), coloured by transcript type and faded when not differentially
expressed. The table-based prepare_profile_data() produces the same
table from loose tables.
Usage
profile_data(self, gene_name, group, levels = NULL, assay = "abundance", ...)

plot_tx_expr(
  self,
  gene_name = NULL,
  group = NULL,
  levels = NULL,
  assay = "abundance",
  log_scale = TRUE,
  label = TRUE,
  ncol = NULL,
  color_palette = NULL,
  ...
)
Arguments
- self
An IsoformicExperiment, or (for
plot_tx_expr()) a profile table produced byprofile_data()/prepare_profile_data().- gene_name
Character vector of gene names or IDs to profile.
- group
Name of the
col_datacolumn defining the groups (x axis).- levels
Optional order of the group levels. Defaults to the factor levels or the order of appearance.
- assay
Name of the transcript assay to summarise (default
"abundance").- ...
Passed on to methods.
- log_scale
Logical, show
log2(mean + 1)on the y axis.- label
Logical, label features at the last group level.
- ncol
Number of facet columns,
NULLfor automatic.- color_palette
Named colour vector per transcript type; defaults to the object's palette or
tx_type_palette().
Value
profile_data() returns a tibble with columns feature_id,
feature_name, feature_type, gene_id, gene_name, group,
mean_expr, sd_expr, n_samples and is_de; the grouping variable
name is stored in the "group_var" attribute. plot_tx_expr() returns
a ggplot object.
Examples
iso <- example_isoformic()
head(profile_data(iso, gene_name = "RBPJ", group = "condition"))
#> # A tibble: 6 × 10
#>   feature_id feature_name feature_type gene_id gene_name group mean_expr sd_expr
#>   <chr>      <chr>        <chr>        <chr>   <chr>     <fct>     <dbl>   <dbl>
#> 1 ENSG00000… RBPJ         gene         ENSG00… RBPJ      pree…   1297.    427.
#> 2 ENSG00000… RBPJ         gene         ENSG00… RBPJ      cont…   1367.    195.
#> 3 ENST00000… RBPJ-201     protein_cod… ENSG00… RBPJ      pree…     11.2    25.1
#> 4 ENST00000… RBPJ-201     protein_cod… ENSG00… RBPJ      cont…      3.95    8.30
#> 5 ENST00000… RBPJ-202     protein_cod… ENSG00… RBPJ      pree…    838.    303.
#> 6 ENST00000… RBPJ-202     protein_cod… ENSG00… RBPJ      cont…   1095.    169.
#> # ℹ 2 more variables: n_samples <int>, is_de <chr>
plot_tx_expr(iso, gene_name = c("RBPJ", "EGFR"), group = "condition")