
library(isoformic)
library(dplyr)

extdata <- fs::path_package("isoformic", "extdata")
fs::dir_ls(extdata)
#> /home/runner/work/_temp/Library/isoformic/extdata/c2.cp.reactome.v2023.1.Hs.symbols.gmt.txt
#> /home/runner/work/_temp/Library/isoformic/extdata/coding_model
#> /home/runner/work/_temp/Library/isoformic/extdata/example.gff3
#> /home/runner/work/_temp/Library/isoformic/extdata/example_experiment
#> /home/runner/work/_temp/Library/isoformic/extdata/example_transcripts.fa.gz
#> /home/runner/work/_temp/Library/isoformic/extdata/knockdown
#> /home/runner/work/_temp/Library/isoformic/extdata/knockdown_annotation
#> /home/runner/work/_temp/Library/isoformic/extdata/mini_annotation
#> /home/runner/work/_temp/Library/isoformic/extdata/mini_draws.parquet
#> /home/runner/work/_temp/Library/isoformic/extdata/mini_quants
#> /home/runner/work/_temp/Library/isoformic/extdata/oarfish
#> /home/runner/work/_temp/Library/isoformic/extdata/oarfish_sc
#> /home/runner/work/_temp/Library/isoformic/extdata/pe_abundance.parquet
#> /home/runner/work/_temp/Library/isoformic/extdata/pe_col_data.parquet
#> /home/runner/work/_temp/Library/isoformic/extdata/pe_deg.parquet
#> /home/runner/work/_temp/Library/isoformic/extdata/pe_det.parquet
#> /home/runner/work/_temp/Library/isoformic/extdata/reactome_subset.gmtThe isoformic method
isoformic interprets RNA-seq data at the level of annotated transcripts. Instead of asking only whether a gene changes between conditions, it asks which of its isoforms change, what type of transcript they are (protein coding, retained intron, nonsense-mediated decay, …) and how the expression of the gene is distributed across them.
Everything revolves around the IsoformicExperiment object. It holds, for the same samples, transcript-level assays, gene-level assays derived from them, the exon structures of every annotated transcript and the differential expression results, all backed by Parquet files on disk.
This article builds the object from quantification and differential expression tables and shows how to look at it. The analyses have one article each:
- Transcriptomic diversity: how many isoforms a gene uses, which one dominates and where isoform switches happen.
- Quantification uncertainty: how well the reads determine each isoform, which isoforms cannot be told apart and how confident each differential expression call is.
- What makes an isoform hard to quantify?: which isoforms the reads leave uncertain, why, and how many Gibbs draws are enough.
- Isoform structure and productivity: open reading frames, nonsense-mediated decay, productive fractions, poison exons and external evidence.
- Alternative polyadenylation: 3’ end usage and 3’ UTR length.
- Functional enrichment by transcript type: gene set enrichment run separately for coding and unproductive transcripts.
- Plots: fold-change, expression profile and genomic context plots.
- Other annotations: T2T-CHM13, Ensembl, RefSeq, haplotype-resolved assemblies, FANTOM CAT and long-read catalogs.
- Working with plain tables: the table-based counterparts of every step.
To start from Salmon output instead of ready-made tables, see From Salmon quantifications to an IsoformicExperiment.
The data
The examples use the placenta RNA-seq dataset from “Landscape of Dysregulated Placental RNA Editing Associated With Preeclampsia”: 8 preeclamptic and 17 control placentas quantified with Salmon (Patro et al. 2017) against GENCODE v33 and tested for differential expression at the transcript level with swish (Zhu et al. 2019) and at the gene level with DESeq2. The tables ship with the package as Parquet files.
abundance <- read_parquet(fs::path(extdata, "pe_abundance.parquet"))
col_data <- read_parquet(fs::path(extdata, "pe_col_data.parquet"))
det <- read_parquet(fs::path(extdata, "pe_det.parquet"))
deg <- read_parquet(fs::path(extdata, "pe_deg.parquet"))

abundance[1:3, 1:4]
#> # A tibble: 3 × 4
#>   transcript_id     SRR11498039 SRR11498040 SRR11498041
#>   <chr>                   <dbl>       <dbl>       <dbl>
#> 1 ENST00000456328.2        6.17         0          4.49
#> 2 ENST00000488147.1       94.0        241.       295.
#> 3 ENST00000466430.5       30.4         49.4       21.5
col_data
#> # A tibble: 25 × 2
#>    sample_id   condition
#>    <chr>       <chr>
#>  1 SRR11498039 preeclampsia
#>  2 SRR11498040 preeclampsia
#>  3 SRR11498041 preeclampsia
#>  4 SRR11498042 preeclampsia
#>  5 SRR11498043 preeclampsia
#>  6 SRR11498044 preeclampsia
#>  7 SRR11498045 preeclampsia
#>  8 SRR11498046 preeclampsia
#>  9 SRR11498063 control
#> 10 SRR11498064 control
#> # ℹ 15 more rows
head(det)
#> # A tibble: 6 × 4
#>   transcript_id      log2FC  pvalue qvalue
#>   <chr>               <dbl>   <dbl>  <dbl>
#> 1 ENST00000456328.2 -0.692  0.0199  0.0940
#> 2 ENST00000488147.1  0.0731 0.652   0.812
#> 3 ENST00000466430.5 -0.146  0.364   0.590
#> 4 ENST00000442987.3 -0.183  0.0841  0.242
#> 5 ENST00000494149.2 -0.728  0.00599 0.0420
#> 6 ENST00000595919.1 -0.0789 0.951   0.977
head(deg)
#> # A tibble: 6 × 7
#>   gene_id            log10mean  stat  log2FC pvalue locfdr qvalue
#>   <chr>                  <dbl> <dbl>   <dbl>  <dbl>  <dbl>  <dbl>
#> 1 ENSG00000000003.15      2.40 -31.0 -0.320  0.0485  0.470  0.125
#> 2 ENSG00000000005.6       1.11  25.4  0.381  0.107   0.798  0.222
#> 3 ENSG00000000419.12      2.45 -17.8 -0.0693 0.260   1      0.417
#> 4 ENSG00000000457.14      2.52  13.8  0.107  0.386   1      0.547
#> 5 ENSG00000000460.17      1.95  19.1  0.162  0.229   1      0.380
#> 6 ENSG00000000938.13      1.70 -22.2 -0.162  0.160   1      0.296
The annotation
isoformic relies on the transcript types of the GENCODE annotation. The annotation must be the one used for quantification, here GENCODE v33. download_reference() fetches it into the package cache (this step needs an internet connection the first time) and prepare_isoformic_annotation() converts the GFF3 file, once, into a directory of Parquet tables.
gff_file <- download_reference(version = "33", file_type = "gff")
#> ℹ '/home/runner/.cache/R/isoformic/gencode.v33.chr_patch_hapl_scaff.annotation.gff3.gz'
#>   already exists.
annot_dir <- prepare_isoformic_annotation(gff_file)
#> ℹ Using cached annotation directory
#>   '/home/runner/.cache/R/isoformic/gencode_v33_chr_patch_hapl_scaff_annotation_gff3'.
fs::dir_ls(annot_dir)
#> /home/runner/.cache/R/isoformic/gencode_v33_chr_patch_hapl_scaff_annotation_gff3/annot_data_exons.parquet
#> /home/runner/.cache/R/isoformic/gencode_v33_chr_patch_hapl_scaff_annotation_gff3/annot_data_genes.parquet
#> /home/runner/.cache/R/isoformic/gencode_v33_chr_patch_hapl_scaff_annotation_gff3/annot_data_transcripts.parquet
#> /home/runner/.cache/R/isoformic/gencode_v33_chr_patch_hapl_scaff_annotation_gff3/annot_metadata.parquet
#> /home/runner/.cache/R/isoformic/gencode_v33_chr_patch_hapl_scaff_annotation_gff3/annot_seq_regions.parquet
The tables can be inspected with read_parquet(), but normally the object reads them for you.
read_parquet(fs::path(annot_dir, "annot_data_transcripts.parquet"), n_max = 3)
#> # A tibble: 3 × 21
#>   transcript_id     transcript_name transcript_type gene_id       source_gene_id
#>   <chr>             <chr>           <chr>           <chr>         <chr>
#> 1 ENST00000618686.1 BX004987.1-201  protein_coding  ENSG00000278… <NA>
#> 2 ENST00000613230.1 AC145212.1-201  protein_coding  ENSG00000277… <NA>
#> 3 ENST00000400754.4 MAFIP-201       protein_coding  ENSG00000274… <NA>
#> # ℹ 16 more variables: source_transcript_id <chr>, tags <chr>,
#> #   coding_status <chr>, transcript_support_level <chr>, tie_score <dbl>,
#> #   cds_start <int>, cds_end <int>, cds_length <int>, is_canonical <lgl>,
#> #   haplotype <chr>, seqid <chr>, start_pos <int>, end_pos <int>, strand <chr>,
#> #   n_exons <int>, tx_length <int>
The cache location and every other setting the package reads are documented in ?isoformic-options.
Building the IsoformicExperiment
A transcript-level abundance table (TPM) with the sample metadata is all that is needed. Transcript IDs are checked against the annotation, sample IDs against the metadata.
iso <- IsoformicExperiment(
  experiment_name = "preeclampsia_placenta",
  annot_path = annot_dir,
  assays = list(abundance = abundance),
  col_data = col_data
)
iso
#> <IsoformicExperiment> preeclampsia_placenta
#>   annotation : gencode_v33_chr_patch_hapl_scaff_annotation_gff3 (67,017 genes, 248,882 transcripts, 1,497,350 exons)
#>   samples    : 25 [condition]
#>   transcripts: 72,385 assayed from 21,637 genes
#>   assays     : abundance
#>   gene assays: derived from transcript assays on demand
#>   DE results : <none>
The object behaves like a SummarizedExperiment:
dim(iso)
#> [1] 72385    25
assay(iso, "abundance")[1:3, 1:3]
#>                   SRR11498039 SRR11498040 SRR11498041
#> ENST00000456328.2       6.168       0.000       4.494
#> ENST00000488147.1      93.959     240.922     295.194
#> ENST00000466430.5      30.399      49.359      21.525
head(row_data(iso))
#> # A tibble: 6 × 19
#>   transcript_id     transcript_name transcript_type  gene_id gene_name gene_type
#>   <chr>             <chr>           <chr>            <chr>   <chr>     <chr>
#> 1 ENST00000456328.2 DDX11L1-202     processed_trans… ENSG00… DDX11L1   transcri…
#> 2 ENST00000488147.1 WASH7P-201      unprocessed_pse… ENSG00… WASH7P    unproces…
#> 3 ENST00000466430.5 AL627309.1-201  lncRNA           ENSG00… AL627309… lncRNA
#> 4 ENST00000442987.3 CICP27-201      processed_pseud… ENSG00… CICP27    processe…
#> 5 ENST00000494149.2 AL627309.6-201  processed_pseud… ENSG00… AL627309… processe…
#> 6 ENST00000595919.1 AL627309.7-201  processed_pseud… ENSG00… AL627309… processe…
#> # ℹ 13 more variables: source_gene_id <chr>, source_transcript_id <chr>,
#> #   tags <chr>, coding_status <chr>, transcript_support_level <chr>,
#> #   tie_score <dbl>, cds_start <int>, cds_end <int>, cds_length <int>,
#> #   is_canonical <lgl>, haplotype <chr>, n_exons <int>, tx_length <int>
col_data(iso)
#> # A tibble: 25 × 2
#>    sample_id   condition
#>    <chr>       <chr>
#>  1 SRR11498039 preeclampsia
#>  2 SRR11498040 preeclampsia
#>  3 SRR11498041 preeclampsia
#>  4 SRR11498042 preeclampsia
#>  5 SRR11498043 preeclampsia
#>  6 SRR11498044 preeclampsia
#>  7 SRR11498045 preeclampsia
#>  8 SRR11498046 preeclampsia
#>  9 SRR11498063 control
#> 10 SRR11498064 control
#> # ℹ 15 more rows
iso[1:5, 1:3]
#> <IsoformicExperiment> preeclampsia_placenta
#>   annotation : gencode_v33_chr_patch_hapl_scaff_annotation_gff3 (67,017 genes, 248,882 transcripts, 1,497,350 exons)
#>   samples    : 3 [condition]
#>   transcripts: 5 assayed from 5 genes
#>   assays     : abundance
#>   gene assays: derived from transcript assays on demand
#>   DE results : <none>
Gene-level assays are derived on demand by summing the isoforms of each gene and cached.
gene_assay(iso, "abundance")[1:3, 1:3]
#>                    SRR11498039 SRR11498040 SRR11498041
#> ENSG00000000003.15     249.107     260.237     225.292
#> ENSG00000000005.6       10.000      14.000      18.000
#> ENSG00000000419.12     300.484     278.667     264.840
head(gene_data(iso))
#> # A tibble: 6 × 14
#>   gene_id   gene_name gene_type source_gene_id gene_class gene_category dhs_type
#>   <chr>     <chr>     <chr>     <chr>          <chr>      <chr>         <chr>
#> 1 ENSG0000… TSPAN6    protein_… <NA>           <NA>       <NA>          <NA>
#> 2 ENSG0000… TNMD      protein_… <NA>           <NA>       <NA>          <NA>
#> 3 ENSG0000… DPM1      protein_… <NA>           <NA>       <NA>          <NA>
#> 4 ENSG0000… SCYL3     protein_… <NA>           <NA>       <NA>          <NA>
#> 5 ENSG0000… C1orf112  protein_… <NA>           <NA>       <NA>          <NA>
#> 6 ENSG0000… FGR       protein_… <NA>           <NA>       <NA>          <NA>
#> # ℹ 7 more variables: coding_status <chr>, cumulative_support <chr>,
#> #   haplotype <chr>, seqid <chr>, start_pos <int>, end_pos <int>, strand <chr>
Adding differential expression results
Results from any tool can be attached: column names such as log2FoldChange, padj, logFC or FDR are standardised to log2FC, pvalue and qvalue, and IDs are validated against the annotation. Significance is flagged with stored cutoffs (absolute log2 fold-change of 1 and adjusted p-value of 0.05 by default).
de_tx(iso) <- det
de_gene(iso) <- deg
de_cutoffs(iso)
#> $log2fc
#> [1] 1
#>
#> $pvalue
#> [1] 0.05
#>
#> $use_fdr
#> [1] TRUE

head(de_tx(iso, sig_only = TRUE))
#> # A tibble: 6 × 5
#>   transcript_id     log2FC      pvalue    qvalue det_sig
#>   <chr>              <dbl>       <dbl>     <dbl> <chr>
#> 1 ENST00000334433.7  -8.65 0.000000138 0.0000236 yes
#> 2 ENST00000084795.9  -8.23 0.000000138 0.0000236 yes
#> 3 ENST00000601306.1  -8.02 0.0000710   0.00188   yes
#> 4 ENST00000525681.5  -7.57 0.000267    0.00489   yes
#> 5 ENST00000392177.8  -7.35 0.000115    0.00267   yes
#> 6 ENST00000579374.5  -7.17 0.000000138 0.0000236 yes
head(de_gene(iso, sig_only = TRUE))
#> # A tibble: 6 × 8
#>   gene_id            log10mean  stat log2FC      pvalue   locfdr  qvalue deg_sig
#>   <chr>                  <dbl> <dbl>  <dbl>       <dbl>    <dbl>   <dbl> <chr>
#> 1 ENSG00000174697.5       3.96  68     6.51 0.000000462  5.48e-5 2.58e-5 yes
#> 2 ENSG00000070404.10      4.20  68     5.23 0.000000462  5.48e-5 2.58e-5 yes
#> 3 ENSG00000169495.5       3.76  68     4.50 0.000000462  5.48e-5 2.58e-5 yes
#> 4 ENSG00000196136.18      1.99  53.6   3.72 0.000263     9.92e-3 2.55e-3 yes
#> 5 ENSG00000104827.12      4.34  68     3.65 0.000000462  5.48e-5 2.58e-5 yes
#> 6 ENSG00000232434.2       2.28  67.0   3.53 0.000000462  5.48e-5 2.58e-5 yes
de_table() combines both levels in one long table, one row per feature, which is what the plots consume.
de_table(iso) |>
  filter(gene_name == "RBPJ")
#> # A tibble: 11 × 9
#>    feature_id        feature_name feature_type gene_id gene_name  log2FC  pvalue
#>    <chr>             <chr>        <chr>        <chr>   <chr>       <dbl>   <dbl>
#>  1 ENSG00000168214.… RBPJ         gene         ENSG00… RBPJ      -0.333  1.04e-2
#>  2 ENST00000355476.7 RBPJ-205     protein_cod… ENSG00… RBPJ       1.78   4.46e-5
#>  3 ENST00000507561.5 RBPJ-214     protein_cod… ENSG00… RBPJ      -1.49   2.90e-2
#>  4 ENST00000342295.5 RBPJ-201     protein_cod… ENSG00… RBPJ       0.671  7.83e-1
#>  5 ENST00000348160.8 RBPJ-204     protein_cod… ENSG00… RBPJ       0.644  1.20e-2
#>  6 ENST00000505727.1 RBPJ-210     retained_in… ENSG00… RBPJ      -0.508  7.23e-2
#>  7 ENST00000342320.8 RBPJ-202     protein_cod… ENSG00… RBPJ      -0.503  1.26e-5
#>  8 ENST00000514380.5 RBPJ-225     retained_in… ENSG00… RBPJ       0.498  9.92e-2
#>  9 ENST00000504907.5 RBPJ-208     protein_cod… ENSG00… RBPJ      -0.0816 8.37e-1
#> 10 ENST00000361572.… RBPJ-206     protein_cod… ENSG00… RBPJ      -0.0791 9.67e-1
#> 11 ENST00000512351.5 RBPJ-222     protein_cod… ENSG00… RBPJ      -0.0429 5.39e-1
#> # ℹ 2 more variables: qvalue <dbl>, is_de <chr>
A first look
The fold-change plot compares the change of a gene with that of each of its transcripts, coloured by transcript type; the plots article covers the others.
plot_log2fc(iso, feature = "RBPJ")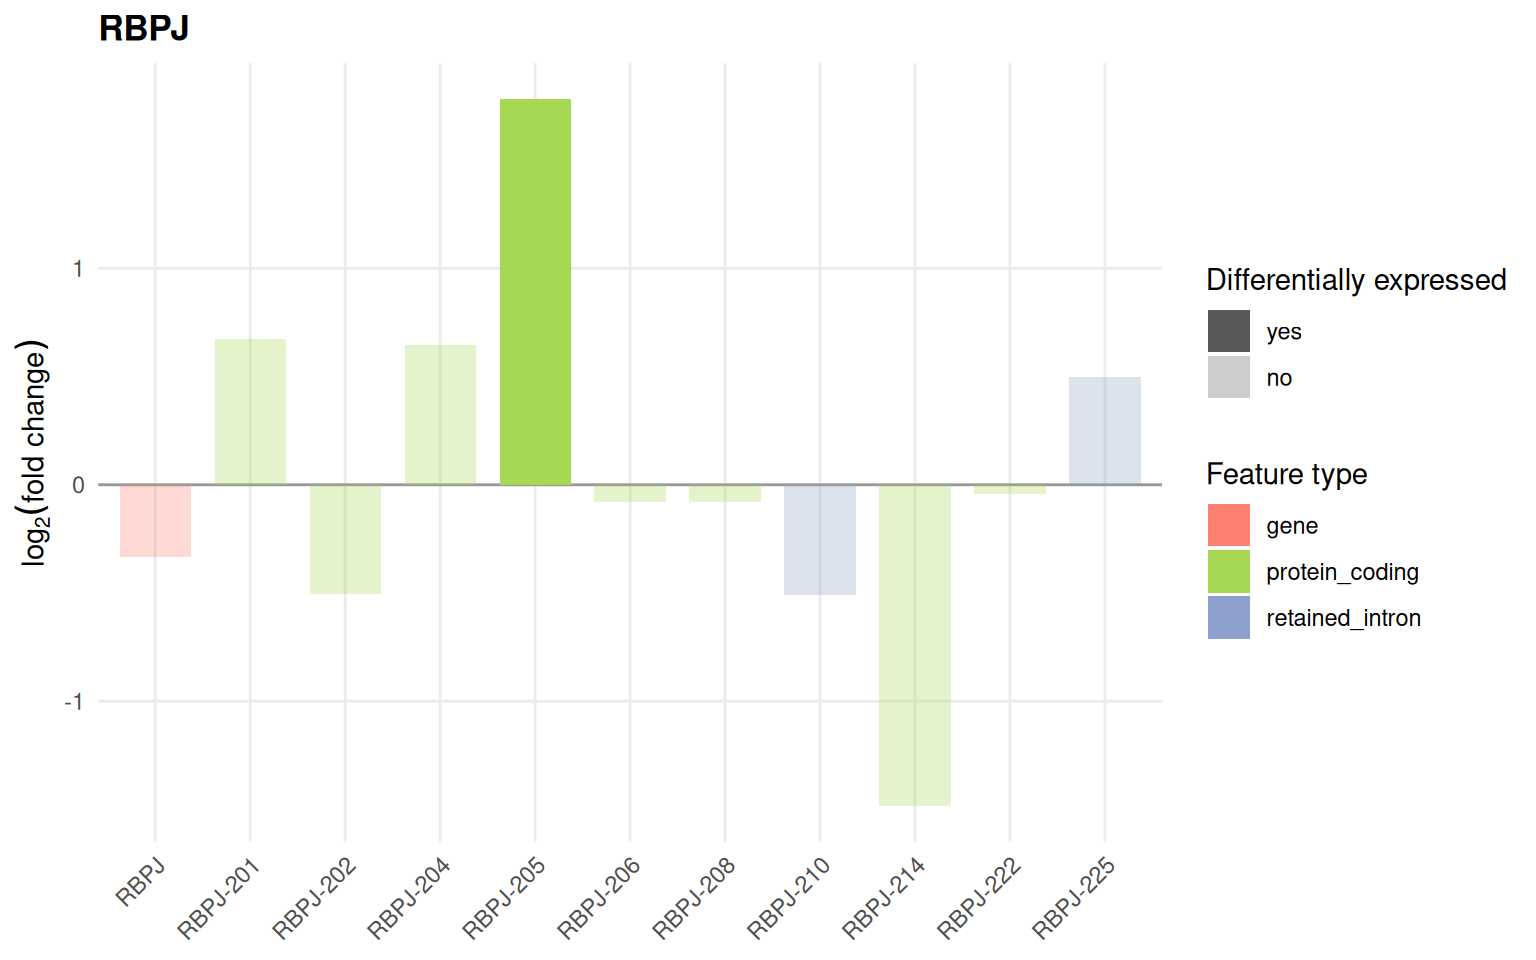
Saving the experiment
The whole object, including results, is written as a directory of Parquet files and restored with read_isoformic().
out_dir <- fs::path(tempdir(), "preeclampsia_placenta")
iso <- write_isoformic(iso, out_dir, overwrite = TRUE)
iso@data_path
#> [1] "/tmp/RtmpiP6AzE/preeclampsia_placenta"
fs::dir_ls(out_dir, recurse = TRUE)
#> /tmp/RtmpiP6AzE/preeclampsia_placenta/assays
#> /tmp/RtmpiP6AzE/preeclampsia_placenta/assays/abundance.parquet
#> /tmp/RtmpiP6AzE/preeclampsia_placenta/col_data.parquet
#> /tmp/RtmpiP6AzE/preeclampsia_placenta/dea
#> /tmp/RtmpiP6AzE/preeclampsia_placenta/dea/deg.parquet
#> /tmp/RtmpiP6AzE/preeclampsia_placenta/dea/det.parquet
#> /tmp/RtmpiP6AzE/preeclampsia_placenta/experiment.parquet
#> /tmp/RtmpiP6AzE/preeclampsia_placenta/tx_type_palette.parquet
read_isoformic(out_dir)
#> <IsoformicExperiment> preeclampsia_placenta
#>   annotation : gencode_v33_chr_patch_hapl_scaff_annotation_gff3 (67,017 genes, 248,882 transcripts, 1,497,350 exons)
#>   samples    : 25 [condition]
#>   transcripts: 72,385 assayed from 21,637 genes
#>   assays     : abundance
#>   gene assays: derived from transcript assays on demand
#>   DE results : det (72,385 transcripts), deg (21,637 genes)
#>   on disk    : /tmp/RtmpiP6AzE/preeclampsia_placenta
Every other article starts from this object; the block below is all it takes to rebuild it.
library(isoformic)
extdata <- fs::path_package("isoformic", "extdata")
annot_dir <- prepare_isoformic_annotation(download_reference(version = "33", file_type = "gff"))
iso <- IsoformicExperiment(
  experiment_name = "preeclampsia_placenta",
  annot_path = annot_dir,
  assays = list(abundance = read_parquet(fs::path(extdata, "pe_abundance.parquet"))),
  col_data = read_parquet(fs::path(extdata, "pe_col_data.parquet"))
)
de_tx(iso) <- read_parquet(fs::path(extdata, "pe_det.parquet"))
de_gene(iso) <- read_parquet(fs::path(extdata, "pe_deg.parquet"))
Session information
sessionInfo()
#> R version 4.6.2 (2026-10-29)
#> Platform: x86_64-pc-linux-gnu
#> Running under: Ubuntu 26.04.1 LTS
#>
#> Matrix products: default
#> BLAS:   /usr/lib/x86_64-linux-gnu/openblas-pthread/libblas.so.3
#> LAPACK: /usr/lib/x86_64-linux-gnu/openblas-pthread/libopenblasp-r0.3.32.so;  LAPACK version 3.12.0
#>
#> locale:
#>  [1] LC_CTYPE=C.UTF-8       LC_NUMERIC=C           LC_TIME=C.UTF-8
#>  [4] LC_COLLATE=C.UTF-8     LC_MONETARY=C.UTF-8    LC_MESSAGES=C.UTF-8
#>  [7] LC_PAPER=C.UTF-8       LC_NAME=C              LC_ADDRESS=C
#> [10] LC_TELEPHONE=C         LC_MEASUREMENT=C.UTF-8 LC_IDENTIFICATION=C
#>
#> time zone: UTC
#> tzcode source: system (glibc)
#>
#> attached base packages:
#> [1] stats     graphics  grDevices utils     datasets  methods   base
#>
#> other attached packages:
#> [1] dplyr_1.2.1          isoformic_0.1.2.9022
#>
#> loaded via a namespace (and not attached):
#>  [1] gtable_0.3.6       jsonlite_2.0.0     compiler_4.6.2     crayon_1.5.3
#>  [5] tidyselect_1.2.1   scales_1.4.0       yaml_2.3.12        fastmap_1.2.0
#>  [9] ggplot2_4.0.3      R6_2.6.1           labeling_0.4.3     generics_0.1.4
#> [13] curl_8.1.0         knitr_1.52         tibble_3.3.1       DBI_1.3.0
#> [17] pillar_1.11.1      RColorBrewer_1.1-3 rlang_1.3.0        utf8_1.2.6
#> [21] xfun_0.62          fs_2.1.0           S7_0.2.2           otel_0.3.0
#> [25] cli_3.6.6          withr_3.0.3        magrittr_2.0.5     digest_0.6.39
#> [29] grid_4.6.2         lifecycle_1.0.5    vctrs_0.7.3        evaluate_1.0.5
#> [33] glue_1.8.1         farver_2.1.2       duckdb_2.0.0       rmarkdown_2.32
#> [37] tools_4.6.2        pkgconfig_2.0.3    htmltools_0.5.9
References
Patro, R, G Duggal, MI Love, RA Irizarry, and C Kingsford. 2017. “Salmon Provides Fast and Bias-Aware Quantification of Transcript Expression.” Nature Methods 14: 417–19. https://doi.org/10.1038/nmeth.4197.
Zhu, A, A Srivastava, JG Ibrahim, R Patro, and MI Love. 2019. “Nonparametric expression analysis using inferential replicate counts.” Nucleic Acids Research 47: e105. https://doi.org/10.1093/nar/gkz622.