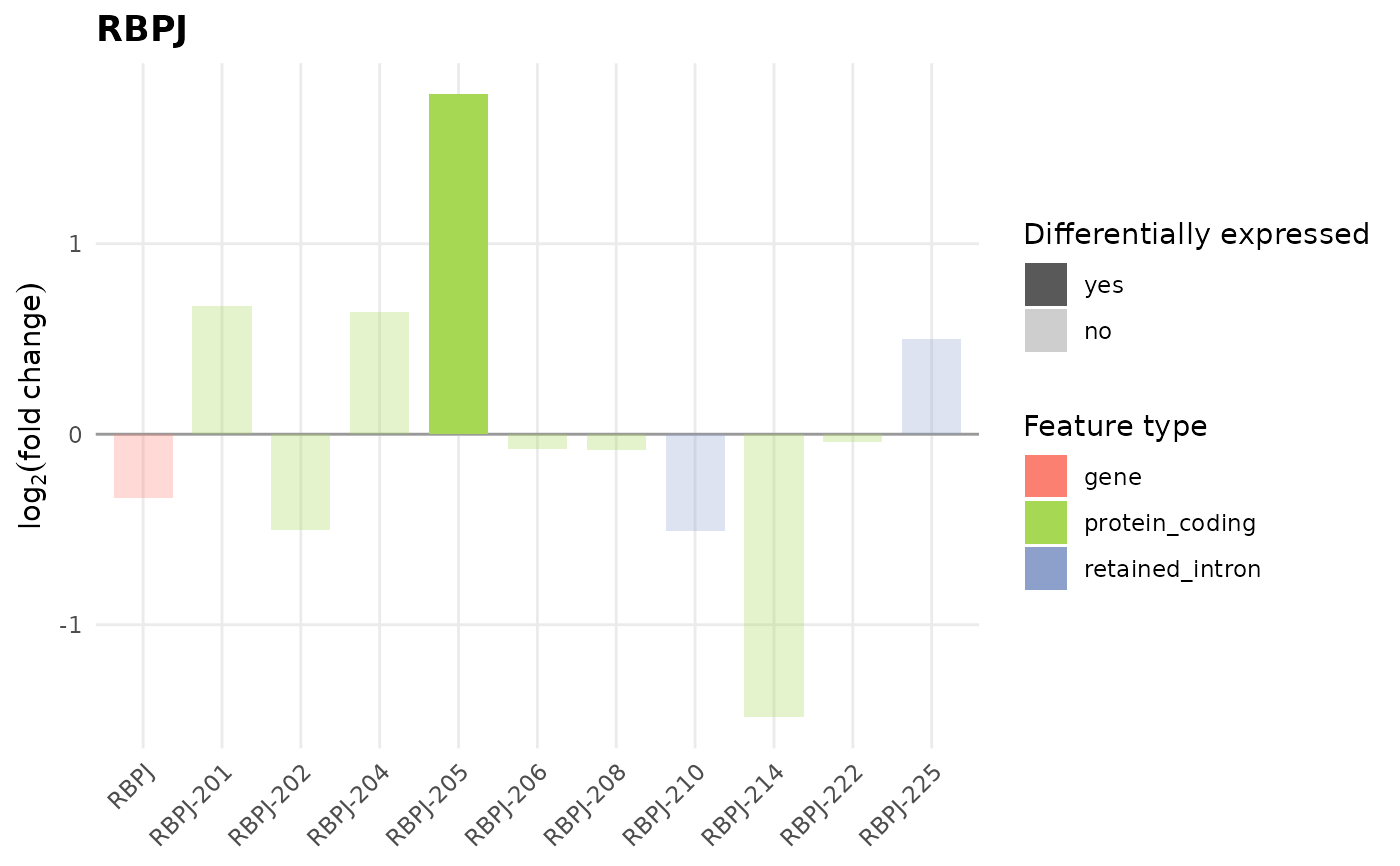
Bar plot of the log2 fold-change of one or more genes next to the
fold-changes of each of their transcripts, coloured by transcript type
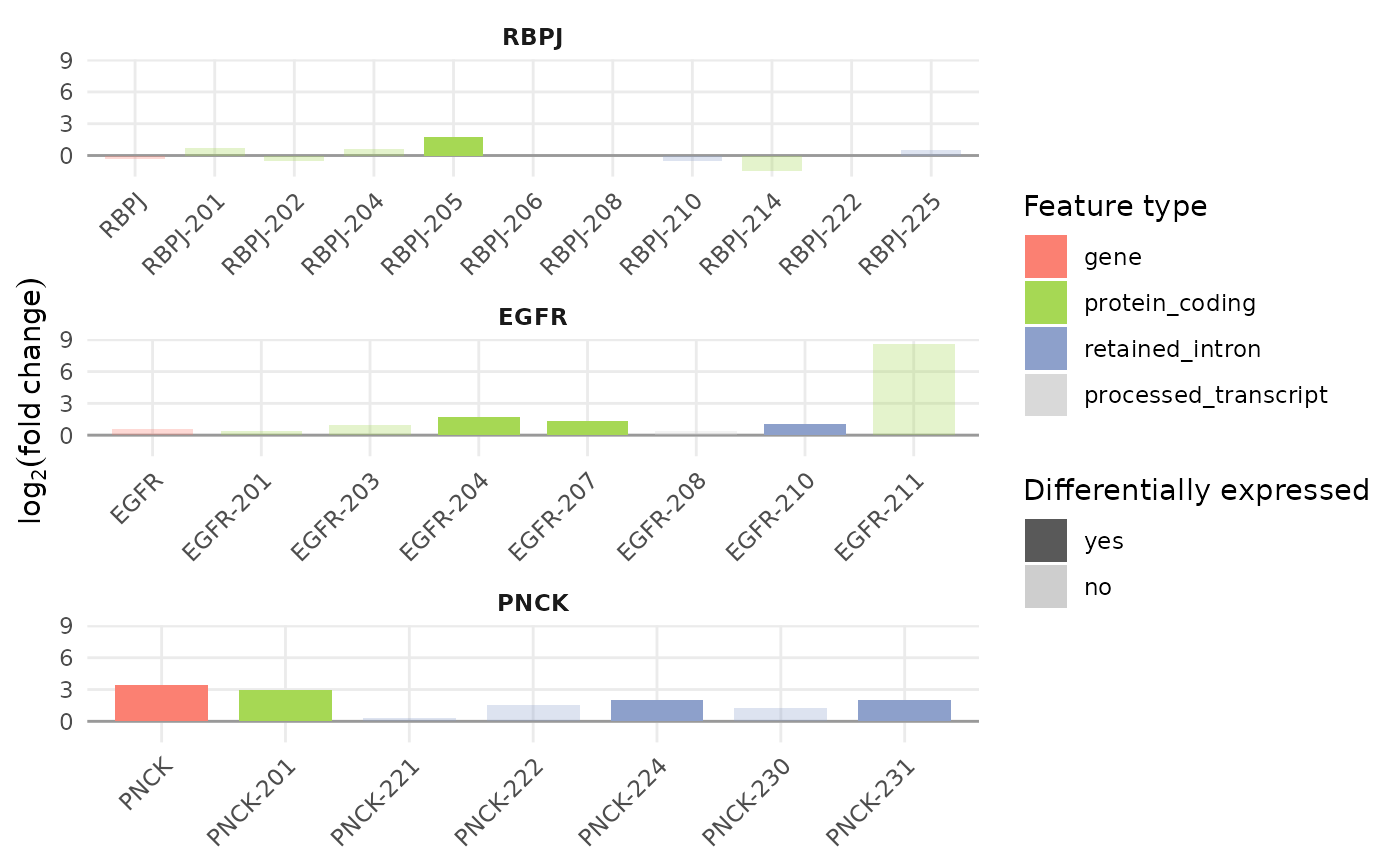
and faded when not significant. With several genes, one panel per gene
is drawn. The IsoformicExperiment method uses the stored differential
expression results (see de_table()); the data frame method accepts the
long table produced by de_table() or join_DEG_DET().
Usage
plot_log2fc(
  self,
  feature,
  feature_column = "gene_name",
  color_palette = NULL,
  ncol = NULL,
  ...
)

plot_log2FC(
  de_data,
  feature,
  feature_column = "gene_name",
  color_palette = NULL,
  ncol = NULL
)
Arguments
- self
An IsoformicExperiment or a long DE table.
- feature
Character vector of gene names (or IDs, or transcript names, matched against
feature_column).- feature_column
Column of the DE table used to select features (default
"gene_name").- color_palette
Named colour vector per transcript type; defaults to the object's palette or
tx_type_palette().- ncol
Number of facet columns,
NULLfor automatic.- ...
Passed on to methods.
- de_data
A long DE table (see
de_table()).
Examples
iso <- example_isoformic()
plot_log2fc(iso, feature = "RBPJ")
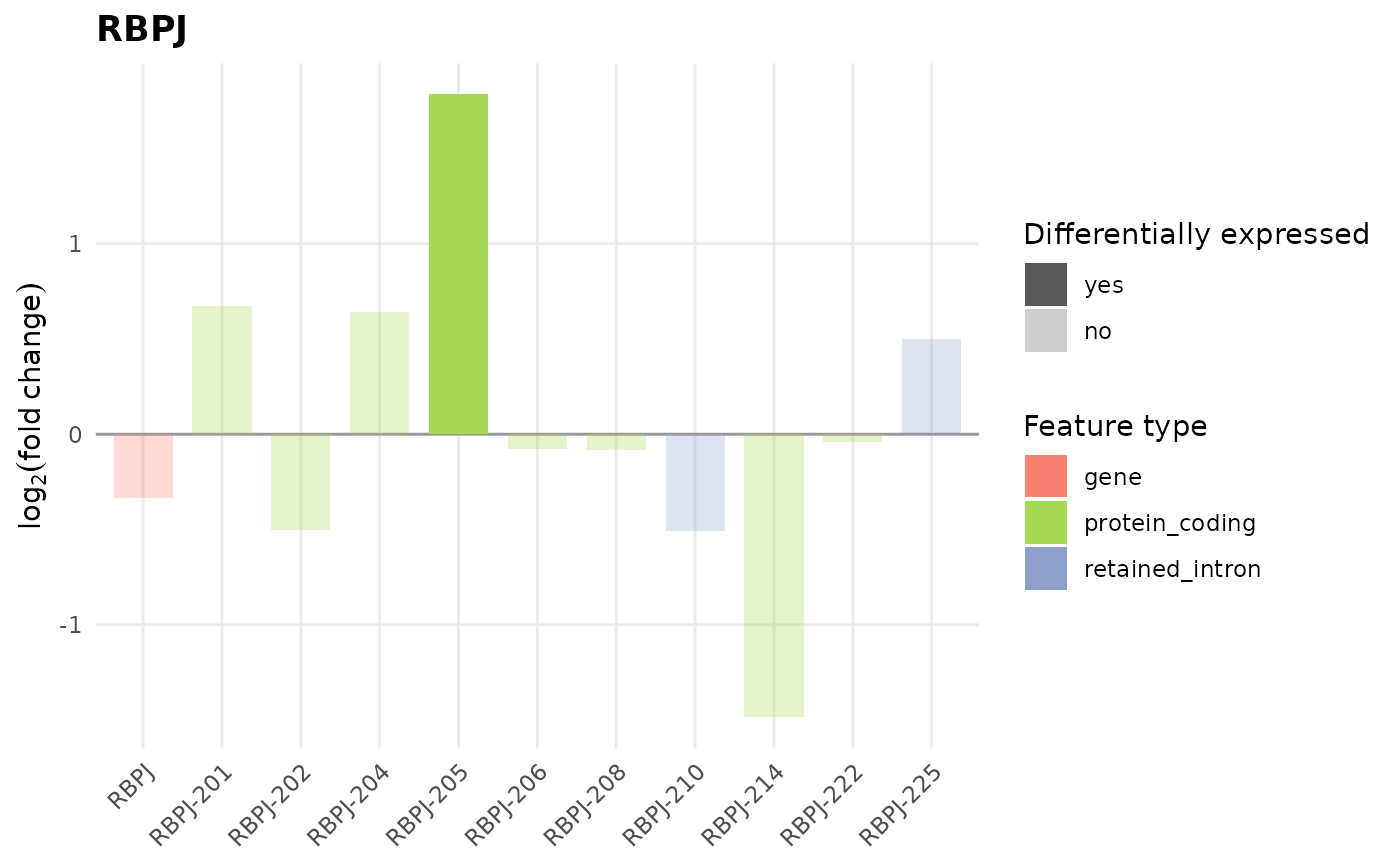 plot_log2fc(iso, feature = c("RBPJ", "EGFR", "PNCK"), ncol = 1)
 # Table-based
plot_log2fc(de_table(iso), feature = "RBPJ")