Plot Log2 Fold-Change Results for Transcripts of Selected Genes
Source:R/plot_log2FC.R
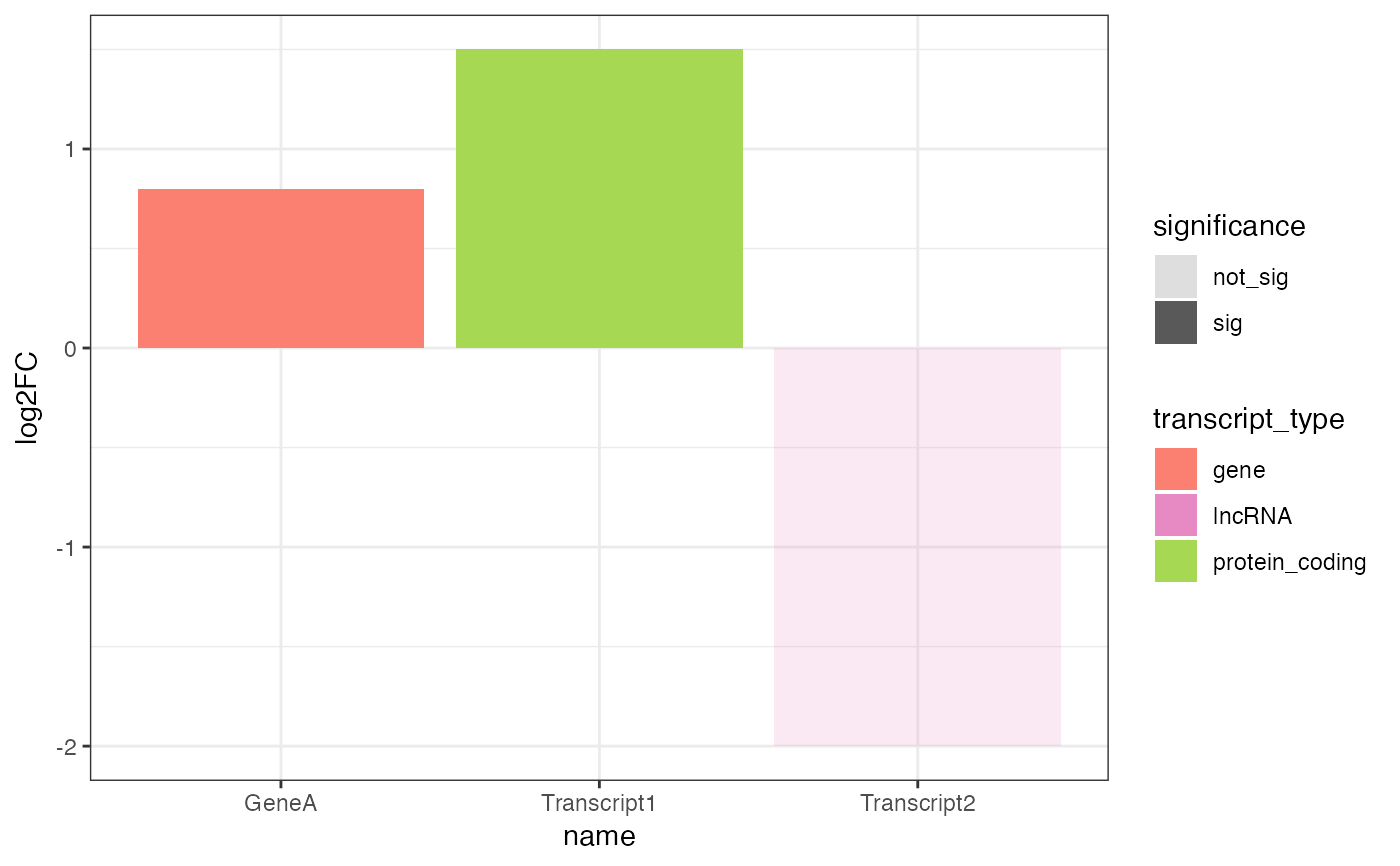
plot_log2FC.RdCreates a bar plot of log2 fold-change values for transcripts of a selected gene, differentiating transcript types and significance levels.
Usage
plot_log2FC(
  de_data,
  feature,
  feature_column = "gene_name",
  color_palette = NULL
)

plot_log2fc(self, ...)
Arguments
- de_data
A
data.frameortibblecontaining combined gene and transcript differential expression results. Should contain columns for log2 fold-change, transcript type, significance, and feature symbols.- feature
A character string specifying the gene name to plot.
- feature_column
A character string specifying the column name in
de_datathat contains gene names. Default is"gene_name".- color_palette
A named character vector specifying colors for different transcript types. If
NULL, a default palette will be used.- self
Input object, either a
data.frameor anIsoformicExperiment.- ...
Additional arguments passed to the method.
Details
The function filters the input table for the selected gene and creates a bar plot of log2 fold-change values.
If all transcripts are significant, it plots without adjusting alpha transparency; otherwise, it adjusts alpha
based on significance. The function uses predefined colors for transcript types, which can be overridden
by providing custom_colors.
Examples
# Sample data
de_table_long <- data.frame(
  feature_name = c("Transcript1", "Transcript2", "Transcript3", "GeneA"),
  feature_id = c("TX1", "TX2", "TX3", "GENEA"),
  gene_name = c("GeneA", "GeneA", "GeneA", "GeneA"),
  log2FC = c(1.5, -0.5, -2.0, 0.8),
  feature_type = c("protein_coding", "lncRNA", "retained_intron", "gene"),
  is_de = c("yes", "no", "yes", "yes")
)

# Plot log2 fold-change for the selected gene
plot_obj <- plot_log2FC(
  de_data = de_table_long,
  feature = "GeneA",
  feature_column = "gene_name"
)

# Display the plot
print(plot_obj)